Hamet Model
White paper Calculator
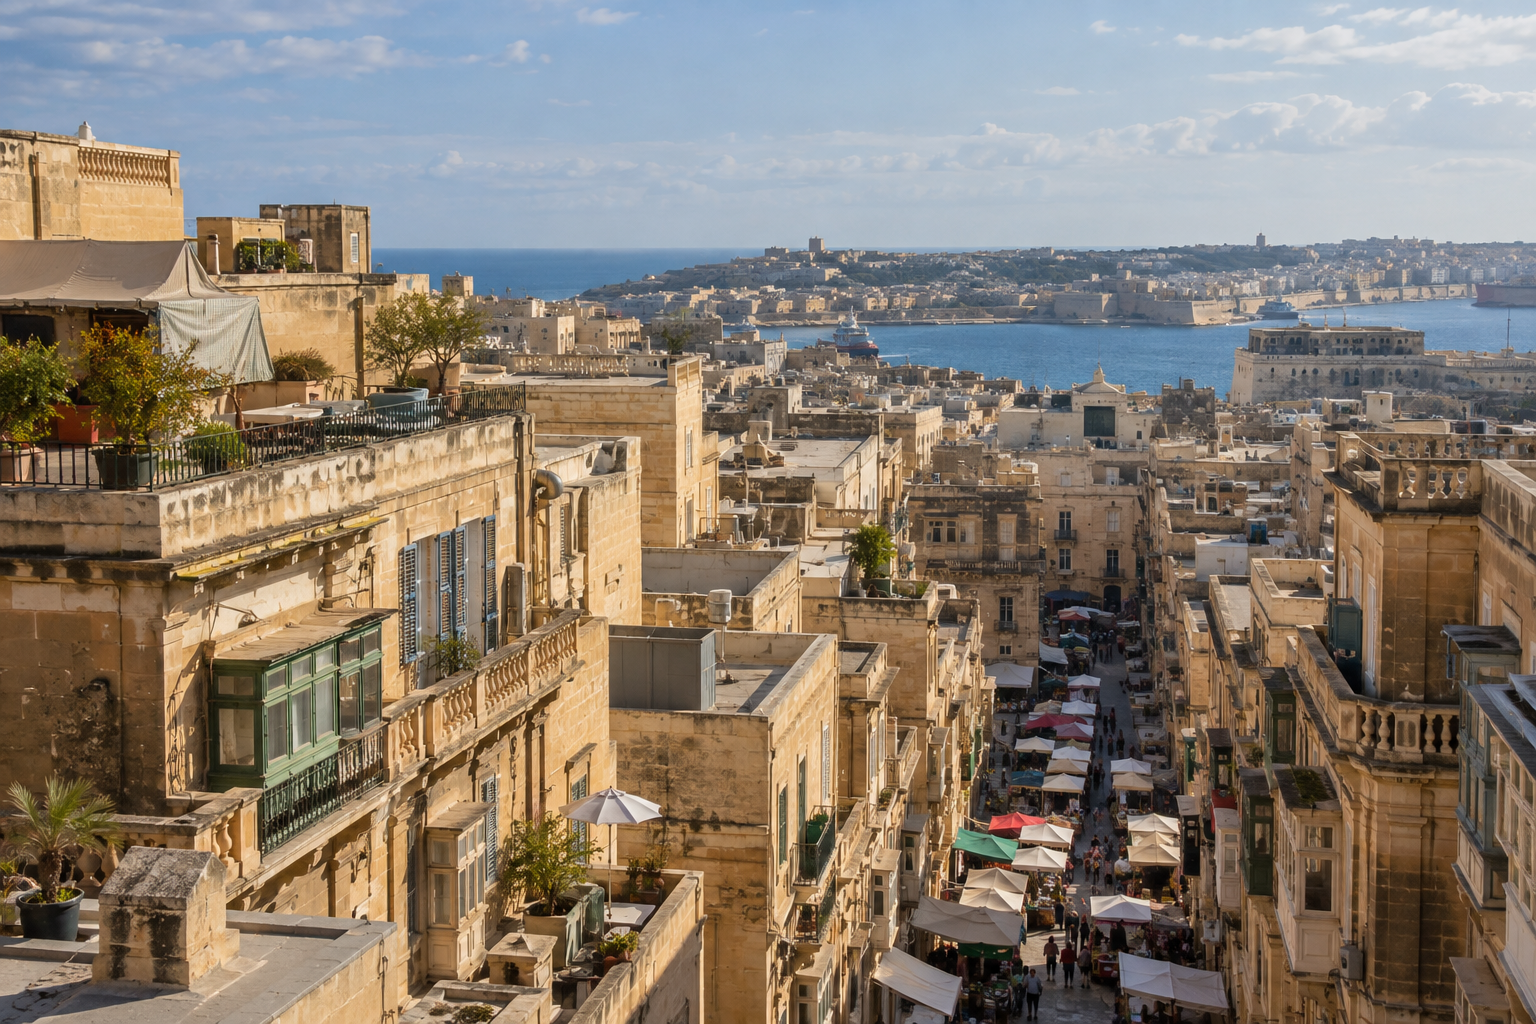
Generated photograph of limestone buildings and a street market overlooking the Mediterranean
Figure 01 · Urban systems and economic activity · AI-generated illustration

Paulus Holdings · Development Research

The Hamet
Model

A composite development index combining economic capacity, educational attainment, and demographic structure.

Run the model

The indicators

Each indicator is scored out of 100. The weights determine its contribution to the final result.

Purchasing power

40%

GDP per person, adjusted for purchasing power parity, compares economic resources while accounting for differences in local prices.

Higher purchasing power → higher score
About this indicator

PPP adjusts for price differences. It is not itself a measure of income or poverty.

Education

40%

A proposed shared assessment measures what students know, using the same 0–100 scale across countries.

Higher assessment results → higher score
About this indicator

A hypothetical assessment, not an existing universal exam. OWID uses schooling and literacy.

Assessment bands: 70–100 good; 50–69 average; 40–49 concerning; below 40 poor.

Fertility rate

20%

The average number of children per woman adds a demographic dimension to how we think about a country’s future.

Higher fertility → higher model score
About this indicator

A deliberate model assumption. Higher fertility does not necessarily mean greater development.

Calculate a score

Adjust the values below to see how the weighted score changes.

Build a country profile

$30,000
0international $$60,000
75%
0out of 100100%
2.5
0children per woman6.0

For exploration only. These profiles are hypothetical, not country data.

Hamet score
58.3/ 100
Moderate model score

Contribution by indicator

PPP40%20.0 / 40
Education40%30.0 / 40
Fertility20%8.3 / 20
A model score, not a definitive judgment of a country’s development.

How it is calculated

Different units need a common scale. We turn each indicator into a score out of 100, then apply its weight.

Hamet score0.4P + 0.4E + 0.2F

P = min(GDP per capita in PPP international dollars ÷ 60,000, 1) × 100. E = the shared assessment percentage. F = min(children per woman ÷ 6, 1) × 100. All inputs are nonnegative. The $60,000 and 6-child ceilings are illustrative design choices, not internationally agreed benchmarks. Real comparisons would need the same data year and PPP price base.

Why these indicators?

Generated photograph of students studying together in a university library
Education and opportunity. AI-generated illustration.

The Hamet Model combines purchasing power, education, and fertility to explore a country’s development from three perspectives. I chose GDP per capita adjusted for purchasing power parity because it helps compare economic resources while accounting for differences in local prices. I paired it with a proposed common education assessment because knowledge and skills influence people’s opportunities. Together, these indicators consider both material resources and the ability to use them, although average incomes can conceal poverty and an exam cannot capture every aspect of learning.

I gave purchasing power and education 40% each because I consider them the strongest foundations of this model. Fertility receives 20% to add a perspective on future generations. My original design rewards higher fertility, but this is a value choice: more births do not automatically improve wellbeing, and demographic needs differ between countries. Keeping its weight lower limits its influence. The model is therefore a transparent classroom proposal, rather than a validated development index; using it in practice would require comparable education data and a careful review of the fertility assumption.

Source

Indicator definitions informed by Our World in Data. Weights and scoring are our proposal.